A common placement for the DMI on a price chart is either below or directly above the price itself. The calculation for it involves comparing the present price and the past price range. After then, DMI shows the outcome as a positive directional indication pointing upwards (+DI or +DMI) and a negative directional signal pointing downwards (-DI or -DMI). The Average Directional Index (ADX) is a trend strength line shown as a consequence of the DMI's calculation of the strength of the upward or downward movement.
Directional Indicators (+DI and -DI)
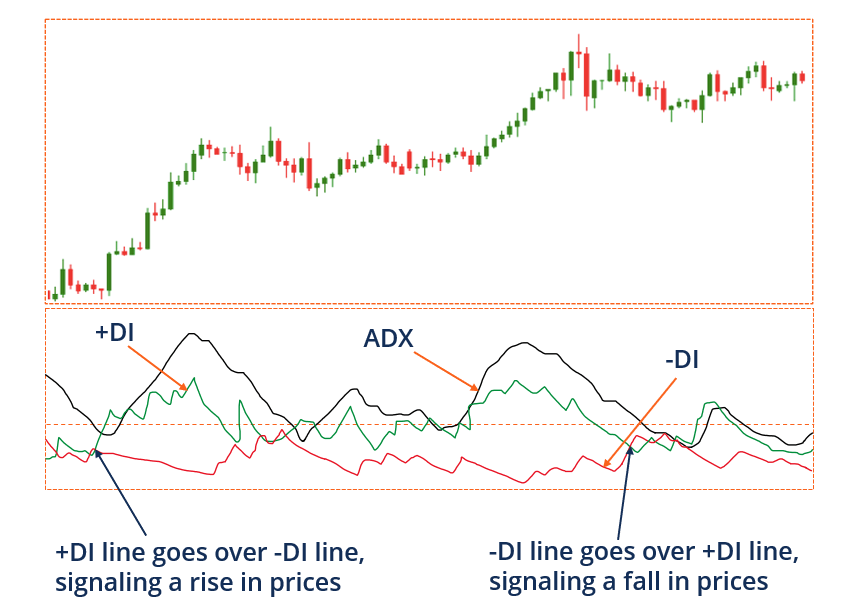
+DI and -DI are shown on the graph by two distinct lines, commonly shaded green and red, respectively. +DI represents the difference between the highest price of the present day and the highest amount of the previous day, whereas -DI does the same calculation using the lowest prices of the current day and the previous day.
If the red line is moving higher than the green line, the price is decreasing. The price goes up if the green line is higher than the red line. If the -DI and +DI are constantly crossing over one another, there is probably no current price trend, and the price is moving in a sideways direction.
Average Directional Index (ADX)
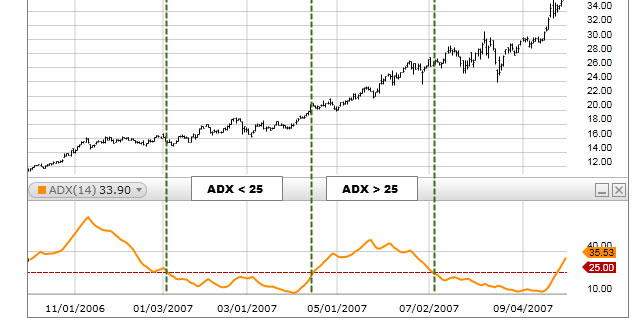
The ADX, which is the third line on the DMI, is a line that indicates how strong the trend is. Therefore, although the -DI and +DI are useful for drawing attention to the direction of the trend, investors rely on the ADX to determine how robust the uptrend or downtrend is. If the ADX value is more than 25, a powerful trend is currently in effect. If the ADX falls below 20, it indicates that there is no trend in the market and that the price is most likely going sideways.
Uses of the Directional Movement Index in Trading
Trading Trends using the Directional Movement Index
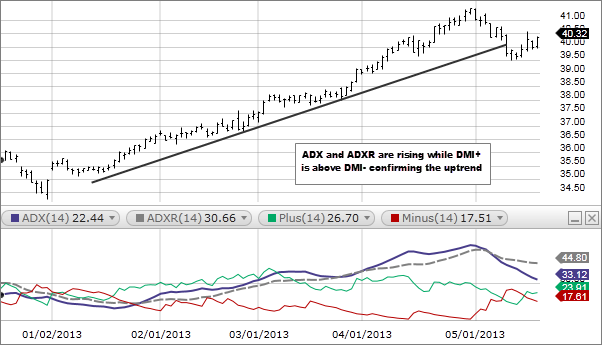
When the +DI line is above -DI line, market has moved in an uptrend, and when -DI line is higher than +DI line, the market is going in a downtrend. This is a basic rule that applies to most situations. When trading using a trending approach, the best time to prefer long positions is when +DI line is located above -DI line. Short positions are more advantageous when -DI is higher than +DI.
Applying the DMI to Determine Trading Ranges
Some traders use the strategy of looking for trades dependent on tumultuous price activity. The ADX is likely to be below 20 when trading is range-bound and turbulent since this indicates that trade volume is quite low. This may give a variety of possibilities, such as an iron condor option spread, which allows the trader to benefit from movement in either direction of the market. Although these sorts of methods profit from ranges, some traders take a somewhat optimistic or bearish stance on price. Directional indicators may be utilized to construct such positions.
Limitations
The DMI is a component of a more comprehensive system referred to as the ADX. The strength values provided by the ADX may be combined with the direction of the trend shown by the DMI. When the ADX shows readings higher than 20, the price moves significantly. Whether or not ADX is used, the indicator still has a high propensity for generating many spurious signals.
It is important to note that +DI and -DI readings and crossings are calculated based on past price data and do not always predict what will occur in the future. It is possible for a crossing to take place, but the price could not react to it, leading to a lost transaction.
It is also possible for the lines to intersect, resulting in several signals but no discernible pattern in the pricing. If you only make trades in the direction of the bigger trend based on long-term price charts, or if you include ADX readings to assist in identifying strong trends, you can help avoid this situation to some extent.
Comparing the DMI to the AROON Indicator
The DMI indication comprises two lines, with a third line completely discretionary. Additionally, the Aroon indicator consists of two lines. Both positive and negative movement is shown by the two indicators, which makes it easier to determine the direction of the trend. However, because of the differences in the computations, the crosses on each indicator will take place at distinct points in time.